
01
Data Health Check
Full Scan of Your SAP Data and Saved Reports
- Saved-Report Review
- Price Lists
- Item Master Data
- Business Partner Master Data
Done: Findings Reviewed With You
Running SAP Business One, but Still:
Delivered In-House on SAP Business One.
Five Connected Practices, All Built on the Same SAP Business One Data.
| Practice | Tools | What It Solves |
|---|---|---|
| SAP B1 & SQL | T-SQL, Query Manager, Crystal Reports | Reports That Finally Match SAP |
| Power BI | DAX, Power Query, Data Modelling | One Live View for Owners and Managers |
| Excel Report Automation | Power Query, Power Automate | No More Rebuilding Reports by Hand |
| Trade & Customs | HTS, Landed Cost, CBSA K32 | Tariffs Priced In, Duty Claimed Back |
| AI & Automation | Claude Code, Python | Hours of Manual Work Removed |
Built by a Working SAP Business One Analyst, Not a Generalist Agency.
Full Scan of Your SAP Data and Saved Reports
Done: Findings Reviewed With You
Auto-Refresh Reports: Excel or Power BI
Done: Reconciled to SAP, Signed Off
See Where Your Business Stands
Done: Signed Off After a Test Cycle
HTS Code and Tariffs
Done: Reviewed With Your Broker
Every project is quoted in writing after the free review, before any work starts.
From First Call to a Report Your Team Trusts.
On your own SAP screens, you show me the report that's off. I explain why, and what fixing it takes. No obligation.
You create a login for me with only the access the work needs.
Totals are reconciled to SAP's own reports, within a tolerance agreed with you, before sign-off.
You get the reports, the documentation and rollout support in English or French.
Projects Delivered on SAP Business One. Client Figures Kept Confidential.
Replenishment planned from real demand, warehouse by warehouse.
The Problem. Reorder points were typed in once and never updated, so stock ran out in one warehouse while it sat idle in another.
What I Built. Min/max per warehouse from 12-month demand, real lead times and the purchasing cycle, in SQL Server and Power BI over both the live and legacy SAP databases.
| Item | On Hand | Min | Max | Multiple | Buy |
|---|---|---|---|---|---|
| Hydraulic hose, 1/2 in | 14 | 40 | 96 | 12 | 84 |
| Brake pad set | 63 | 55 | 120 | 10 | 0 |
| Cable ties, 300 mm | 210 | 300 | 720 | 100 | 600 |
| Air filter | 9 | 6 | 18 | 6 | 0 |
| Fuel cap | 48 | 0 | 0 | — | 0 |
When on hand falls below Min, Buy = Max − on hand, rounded up to the order multiple. Hose: 96 − 14 = 82 → 84. Cable ties: 720 − 210 = 510 → 600. No open POs in this example.
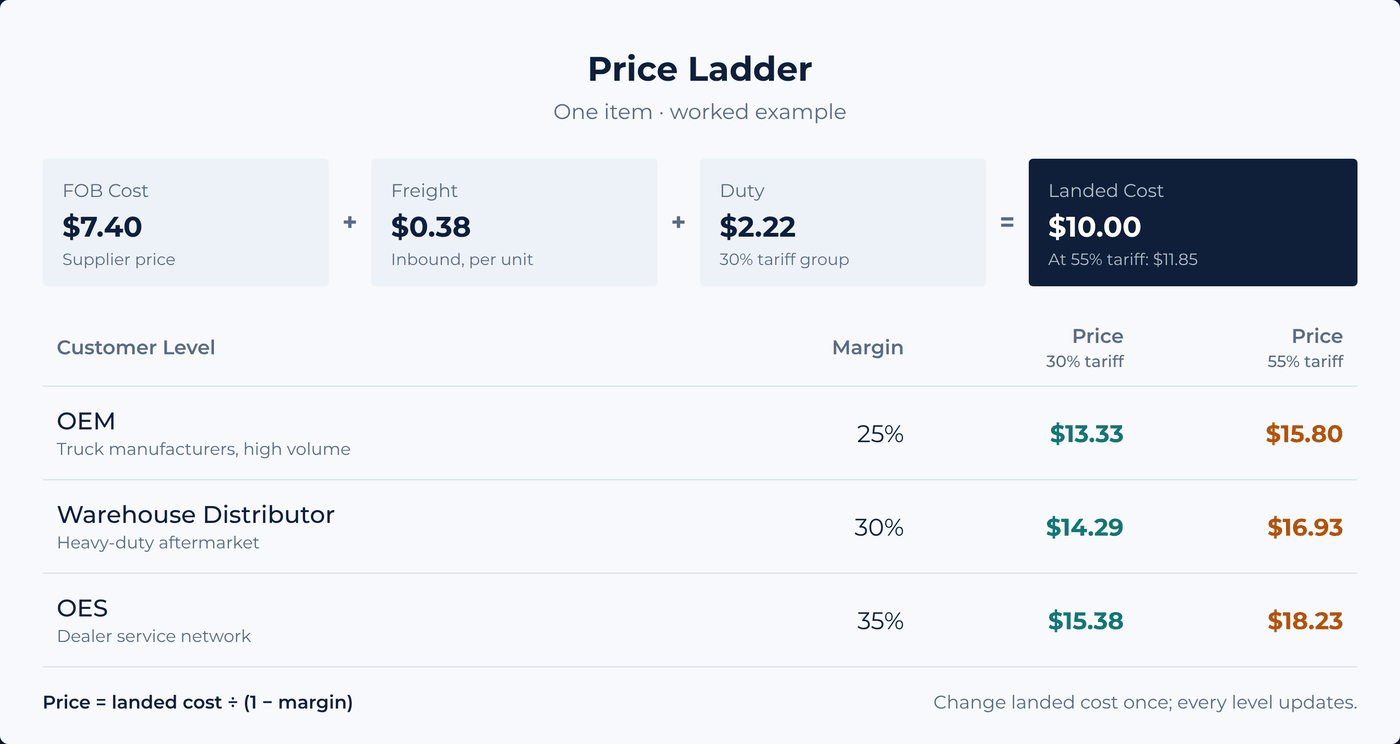
Every customer price level calculated from one landed cost.
The Problem. Prices for warehouse distributors, OES and OEM customers were kept by hand, and supplier price files arrived in different formats.
What I Built. A single landed-cost base price that drives every level's price and margin automatically, plus a tool that merges multi-format supplier files into one master price list.
HTS code, country of origin and landed cost kept complete on every active item.
The Problem. U.S. tariffs changed almost monthly in 2026. Quotes left out Chapter 99 duties, and goods shipped from Canada risked being declared Canadian origin by default.
What I Built. A classification audit in SAP, a duty stack per item, an origin check for re-exported goods, a Section 232 flag for steel and aluminum content, and a landed-cost check on every purchase order line.
| Layer | Rate | Why |
|---|---|---|
| Base duty | 2.5% | Applies |
| Section 301 | +25.0% | China origin |
| Section 338 | 0% | Origin is not Canada |
| Section 232 | on metal value | Needs metal content |
| MPF | 0.3464% | Applies |
| HMF | 0% | Ocean only |
| Effective rate | 27.85% | before Section 232 |
Without a declared metal-content value per item, Section 232 is charged on 100% of the value.
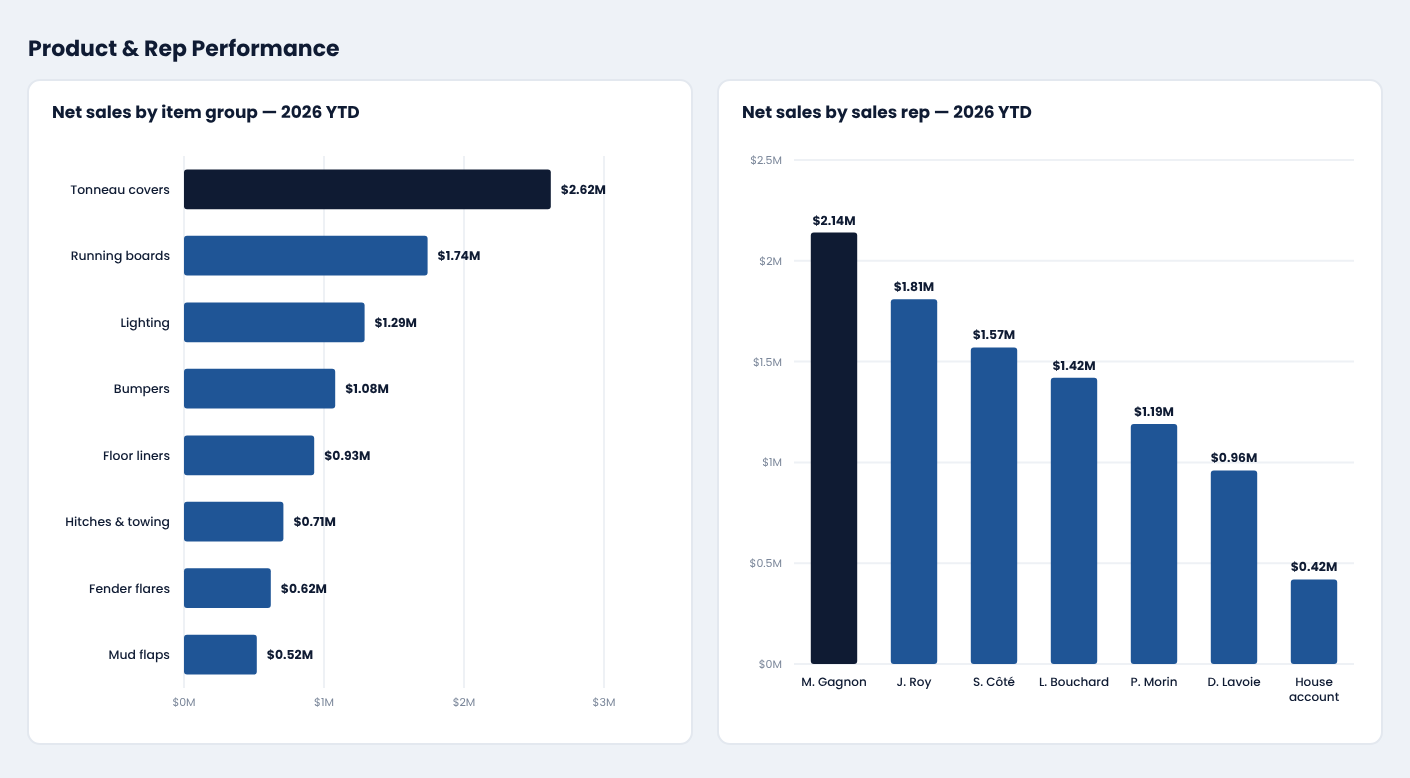
Leadership sees sales, inventory and margin directly, in numbers that match SAP.
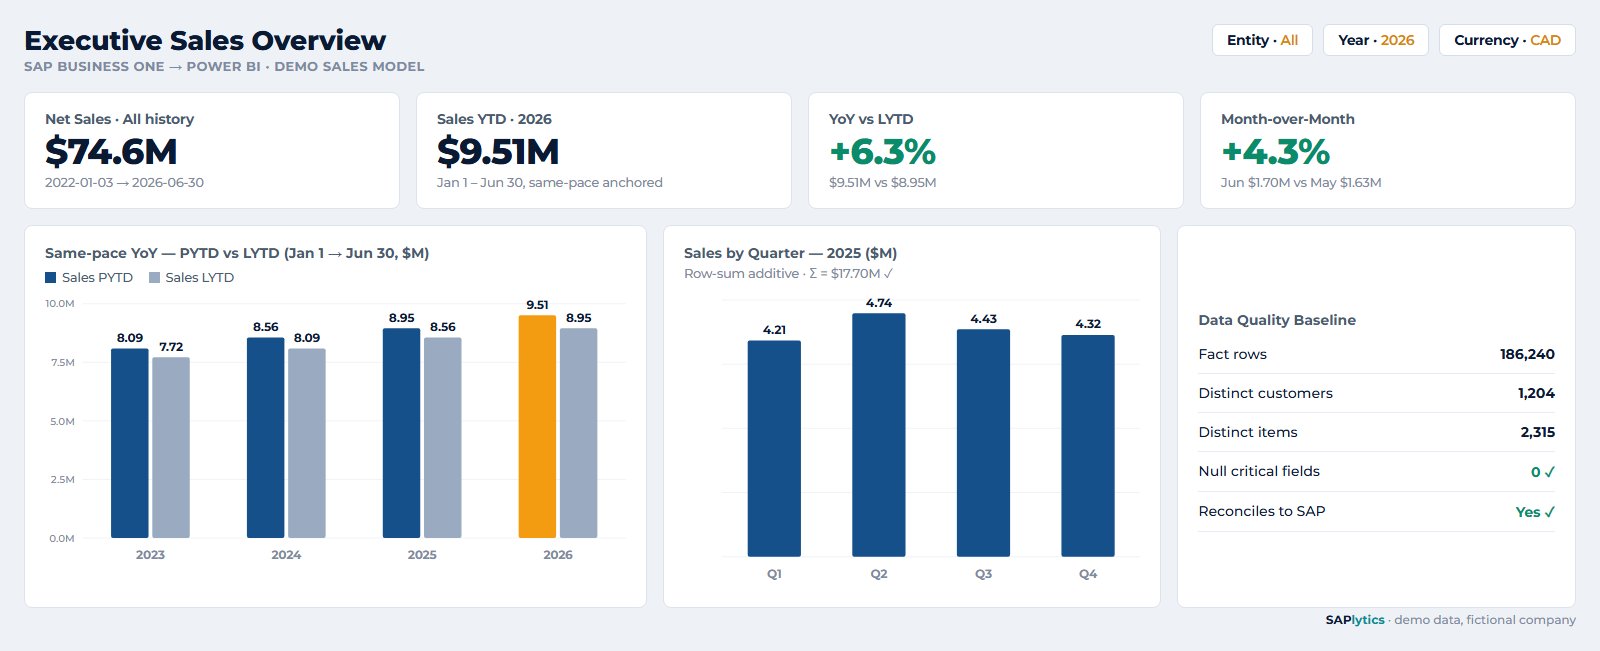
The Problem. Sales reports overstated revenue: cancelled invoices and their reversals were both counted, credit memos were ignored and freight repeated on every line.
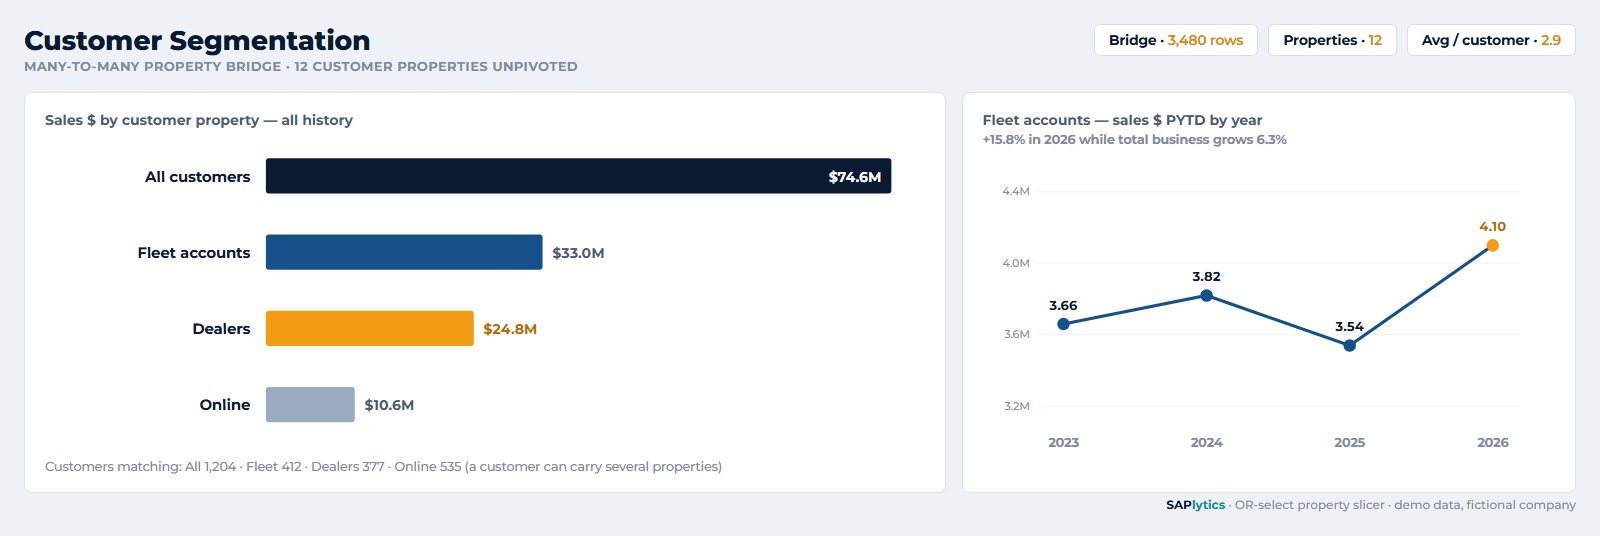
What I Built. A line-level SAP B1 → Power BI model: invoices minus credit memos, freight at document level, same-pace year-to-date versus last year, and a customer bridge so one customer can sit in several segments.
More case studies on the blog: SAP Reporting Library Audit · CBSA Duty Drawback Automation

SAPlytics is how I package what I do: turning a live SAP Business One database into reporting people actually make decisions with.
For more than three years I have owned SAP reporting, master data and import compliance data for distribution and manufacturing companies, as the person the CEO, finance, purchasing, sales and operations teams all come to for numbers. I document how things work today, find the gaps, and replace manual work with SQL, Power BI, Excel and Power Automate, then support people until the new way sticks.
What You Get, How, When, and How Your Data Stays Safe.
Working reports your team uses every day: SAP queries, Excel workbooks that refresh themselves, Power BI dashboards, or all three. Each one comes with documentation and a reconciliation that shows its totals match SAP. You own all of it.
Every project is different, so it is quoted after a short assessment. After the free review, you get a written scope and a quote covering what you will receive and when, before any work starts. No obligation.
It depends on the scope: a Data Health Check is quicker than a full reporting stack. After the free review you get a short written scope with what you'll receive and an estimated timeline, before any work starts.
Free review, then a read-only login, then build and reconcile, then handover with rollout support. I work remotely anywhere, or on site in Montréal and within about 300 km, including Ottawa, in English or French.
Yes. You create the login, with only the access the work needs, and you can switch it off at any time. I only read from SAP; nothing is ever written back, and every query is checked for performance before it runs on your live database.
Yes. SAP Business One on SQL Server or HANA, as long as I can connect to a valid company database.
Yes. Your old and new SAP databases, or several company databases, are combined in the same report, so history and current data sit side by side. Open orders and backorders are rebuilt across the changeover, so nothing is lost or counted twice.
Your team can. Every query and model is documented and handed over, and I stay available for changes and support when you need them.
SQL Your Team Can Review, Validate, and Maintain.
SET TRANSACTION ISOLATION LEVEL READ UNCOMMITTED;
SET NOCOUNT ON;

SELECT YEAR(H.DocDate)  AS [Year],
       SUM(L.Quantity)  AS [Sales Qty],
       SUM(L.LineTotal) AS [Sales $]
FROM OINV H
JOIN INV1 L ON L.DocEntry = H.DocEntry
WHERE H.CANCELED = 'N'
  AND H.DocDate >= '2025-01-01'
  AND H.DocDate <  DATEADD(DAY, 1,
                   CAST(GETDATE() AS date))
GROUP BY YEAR(H.DocDate);Type a table code to see what it holds and how I use it.
One row per customer invoice: customer, dates, totals, currency and status.
How I use it: the base of every sales figure, joined to INV1 for lines and netted against ORIN credit memos. Cancelled documents are filtered out, a common reason SAP sales reports overstate revenue.
Show me which report doesn't match and what it should say; I'll show you why, on your own SAP screens.
Free, No Obligation · Or Connect on LinkedIn